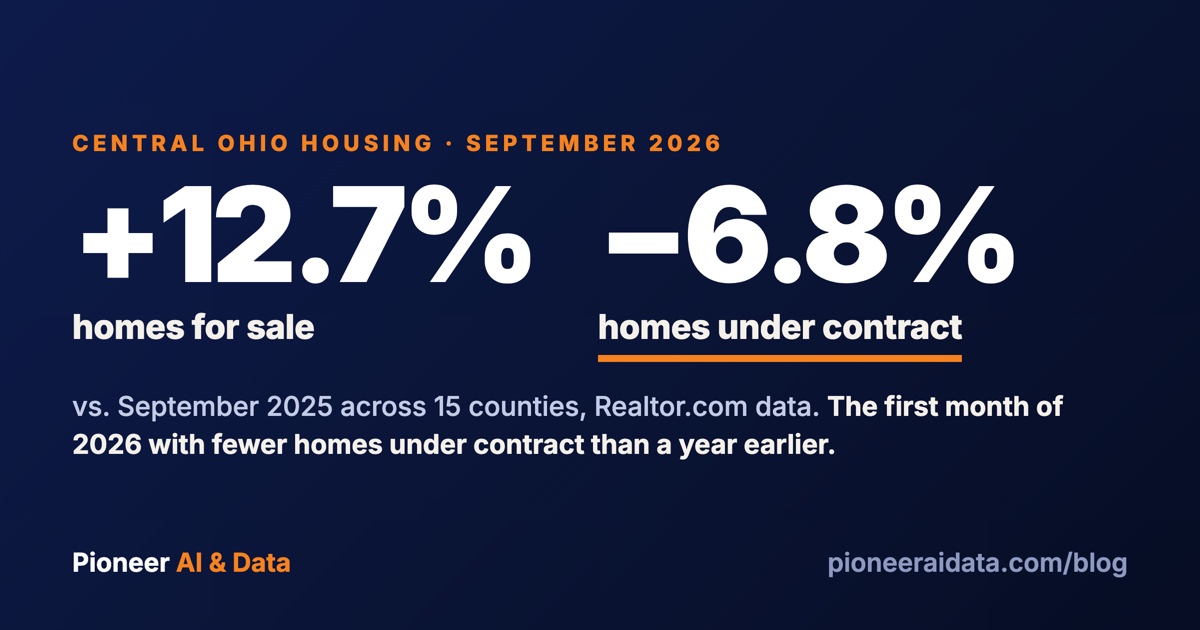
The Central Ohio housing market had 12.7% more homes for sale in September 2026 than in September 2025, the widest gap since March, and 6.8% fewer homes under contract. In both our 15-county count and Realtor.com's Columbus metro count, September was the first month of 2026 with fewer homes under contract than a year earlier. New listings were almost exactly last year's. Asking prices held flat while homes sat on the market longer. In the Columbus metro, 28.8% of listings had a price cut, the highest share for any September in Realtor.com's data.
The county figures here come from the Market Velocity report, which I build every month for the 15 counties of the Mid-Ohio Regional Planning Commission (MORPC) region from free public data, mostly Realtor.com listing counts and Zillow's home value index. Pioneer AI & Data builds the same kind of monthly report that runs itself for businesses. Each issue also forecasts the next month and grades the last call in public, and September's grade is near the bottom of this post.
What the Central Ohio housing market did in September 2026
In September 2026 Central Ohio had more homes for sale than a year earlier and fewer of them under contract or sold, while asking prices held flat.
- Homes for sale: 5,533 active listings across the 15 counties, up from 4,909 in September 2025. Realtor.com's count for the Columbus metro was 4,913, up 13.8%. Realtor.com's national count was up 5.4%.
- Under contract: 3,029 pending listings across the 15 counties, against 3,250 a year earlier. A pending listing is a home under contract that has not closed yet. Realtor.com's Columbus metro count fell 7.5%, and its national count fell 4.1%.
- Prices: Realtor.com's median list price for the Columbus metro was $374,950, against $375,000 in September 2025. Columbus REALTORS reported a September median sale price of $334,250, up 2.8%.
- Sales: Columbus REALTORS counted 2,550 closed sales in September, down 5.7% from September 2025.
- Speed: The median Columbus metro listing spent 48 days on the market in September, three more than a year earlier. Realtor.com's national median was 61 days.
- Price cuts: 28.8% of the Columbus metro's active listings had a price cut in September, up 0.7 of a percentage point from a year earlier. Homes that sold closed at 96.3% of their original list price, against 96.5% in September 2025, according to Columbus REALTORS.
Pending listings fell in September for the first time in 2026
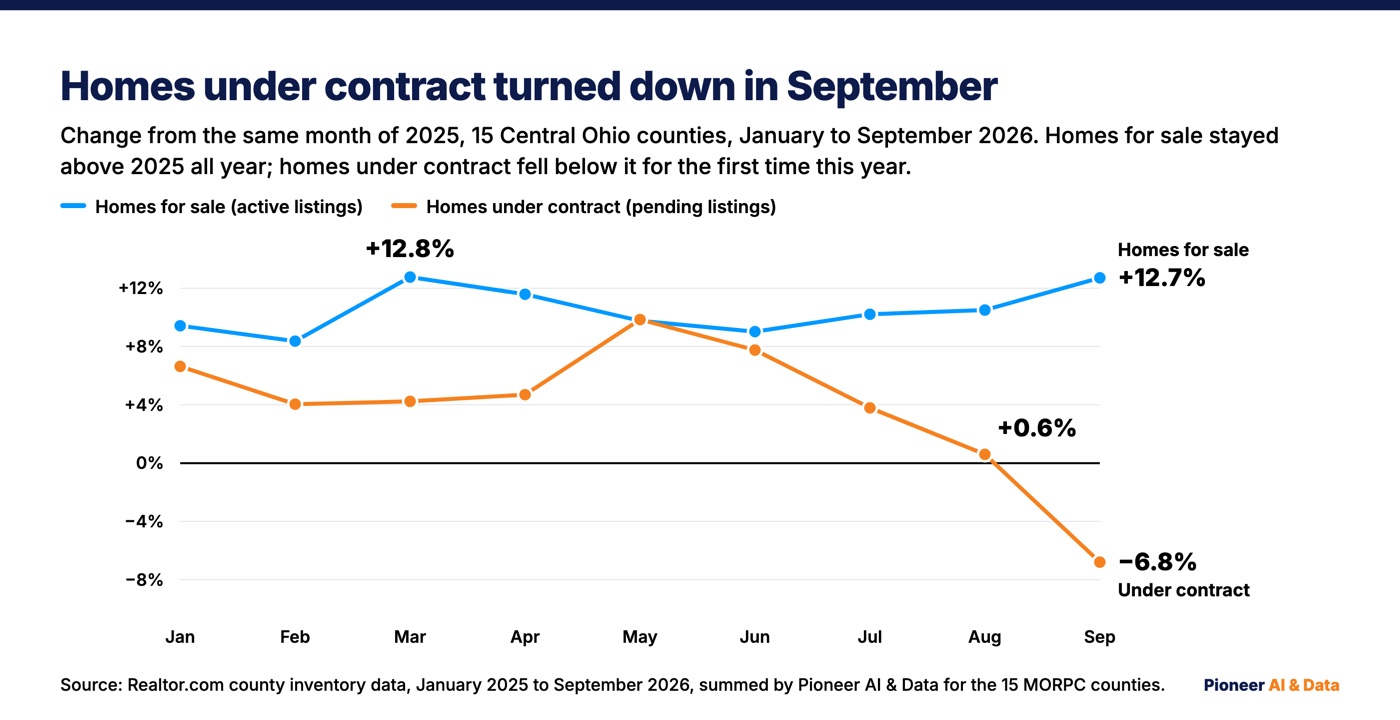
Pending listings across the 15 counties fell 6.8% from a year earlier in September, after running above 2025's level in every month from January through August.
- January through August: pending listings ran above the same month of 2025 every month, peaking at 9.9% above in May and slowing to 0.6% in August.
- September: down 6.8% region-wide, and down from a year earlier in 10 of the 15 counties.
- New listings: 2,762 in September against 2,746, up 0.6%. From January through September, 26,234 homes came on the market against 25,160 in the same months of 2025, up 4.3%.
- Homes for sale: the gap from a year earlier widened from 10.5% in August to 12.7% in September. The 15 counties added 198 homes for sale from August to September, against 81 in the same month of 2025.
All three sources in this post that count contracts moved the same way. Columbus REALTORS reported homes under contract down 12.7% to 2,448, and Realtor.com's Columbus metro count of pending listings fell 7.5% to 2,671. The association's count had already slipped 2.2% in August, and for the year through September it still counted contracts up 0.9% and closed sales up 1.3%.
Mortgage rates rose in every week of September, and the association's release connects the drop in contracts to rates. One month of data can show rising rates and falling contracts together, but not that one caused the other.
The most homes for sale in a Central Ohio September since 2018
The 15 counties had more homes for sale in September 2026 than in any September since 2018, in Realtor.com's county data, which starts in July 2016.
- September 2026: 5,533 homes for sale.
- September 2018: 5,626, the last September with more. September 2016 had 6,857.
- September 2019: 5,067, the last September before the pandemic. September 2026 had 9.2% more.
- September 2020: 2,645, the low point. September 2026 had a little more than twice as many.
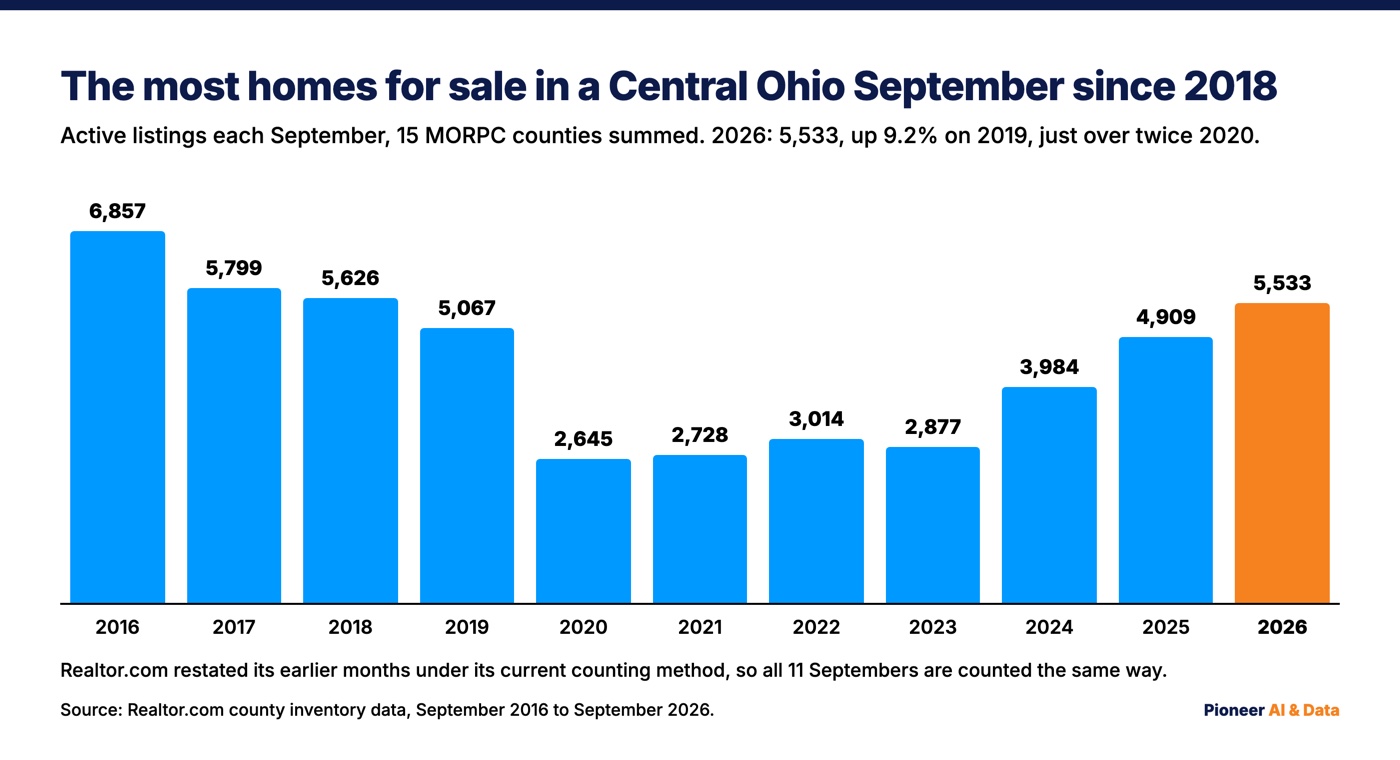
Realtor.com changed how it counts listings in late 2021 and again in 2022, and restated its older months under the new method, so all 11 Septembers are counted the same way. Central Ohio's September count of homes for sale has climbed back past its last pre-pandemic level and is still below the Septembers of 2016 through 2018.
Columbus metro price cuts: the highest September share in Realtor.com's data
In September 2026, 28.8% of the Columbus metro's active listings had a price cut, the highest share for any September in Realtor.com's data, which starts in 2016. Realtor.com's measure is the share of active listings with a price reduction, and its September report put Columbus up 0.7 of a percentage point from a year earlier.
- Every September: the Columbus metro's price-cut share has risen in each of the last six Septembers, from 13.1% in 2020. September 2025 and September 2026 are the only Septembers in the data with a higher share than 2018's 24.5%.
- The highest month: October 2025, at 30.1%, is the only month in Realtor.com's Columbus metro data with a higher price-cut share than September 2026.
- This year: the metro's price-cut share ran below the same month of 2025 from January through May, a tenth of a point or less above it in June and July, and above it by 1.3 points in August and 0.7 in September.
- Other metros: Columbus had the sixth-highest price-cut share of the 50 largest metros in Realtor.com's September table, against 22.3% in Cincinnati and 21.1% in Cleveland. The national share was 20.8%, which Realtor.com called the highest September reading since 2018.
- Sale price against asking price: homes that sold in September closed at 96.3% of their original list price and 98.8% of their last list price, against 96.5% and 98.6% in September 2025, according to the Columbus REALTORS statistics report, which does not count sale concessions. The gap between the original-price and last-price figures comes from asking prices that changed before the sale, and it widened from 2.1 points to 2.5.
Realtor.com and Columbus REALTORS measure different parts of a price cut, over different ground. Realtor.com's share counts how many listings were cut, not by how much. The Columbus REALTORS figures cover only homes that sold, so a listing that was cut and is still for sale is not in them. The association's 2.5-point gap between original and last list price blends how many sold homes had a price change with how big each change was. Price increases were rare by comparison: Realtor.com put the share of Columbus metro listings with a price increase in September at 0.6%, against 28.8% with a price cut.
In Realtor.com's county data, the share of listings with a price cut rose in 6 of the 15 counties and fell in 9, and each county's figure is in the county table below. Union County's price-cut share rose the most, from 18.6% to 30.5%. Marion County's fell the most of the counties without a flagged row, from 29.2% to 22.4%.
Franklin County: more homes for sale, lower asking prices, flat values
In Franklin County, homes for sale rose 13.3% from a year earlier and the median asking price fell 5.4%, while Zillow's estimate of the typical home's value held flat.
- Franklin County had 2,812 active listings in September, 50.8% of the region's 5,533, up from 2,481 a year earlier. Franklin accounted for 331 of the region's 624 extra homes for sale.
- Franklin County's median list price was $314,950, down from $332,950 in September 2025.
- 30.2% of Franklin County's listings had a price cut in September, against 30.3% a year earlier.
- Zillow's home value index for Franklin County was $292,001, against $291,975 a year earlier, a change of 0.01%.
- The median Franklin County listing spent 46 days on the market, against 43 a year earlier.
- Franklin County's pending listings fell 5.2%, from 1,570 to 1,489.
- Franklin County's new listings were down 3.1% in September and up 7.4% for January through September.
A median list price is the middle of whatever happens to be for sale that month. Zillow's home value index is a smoothed, seasonally adjusted estimate of the typical home's value across the whole county. When the two split like this, they are measuring different things, and by Zillow's index the typical Franklin County home was worth about what it was worth a year ago. Franklin's list price and value index split the same way in August.
Zillow's index rose year over year in all 15 counties, from 0.01% in Franklin to 4.6% in Knox. Median list prices fell in 7 of the 15.
Central Ohio county by county: where homes for sale and contracts moved
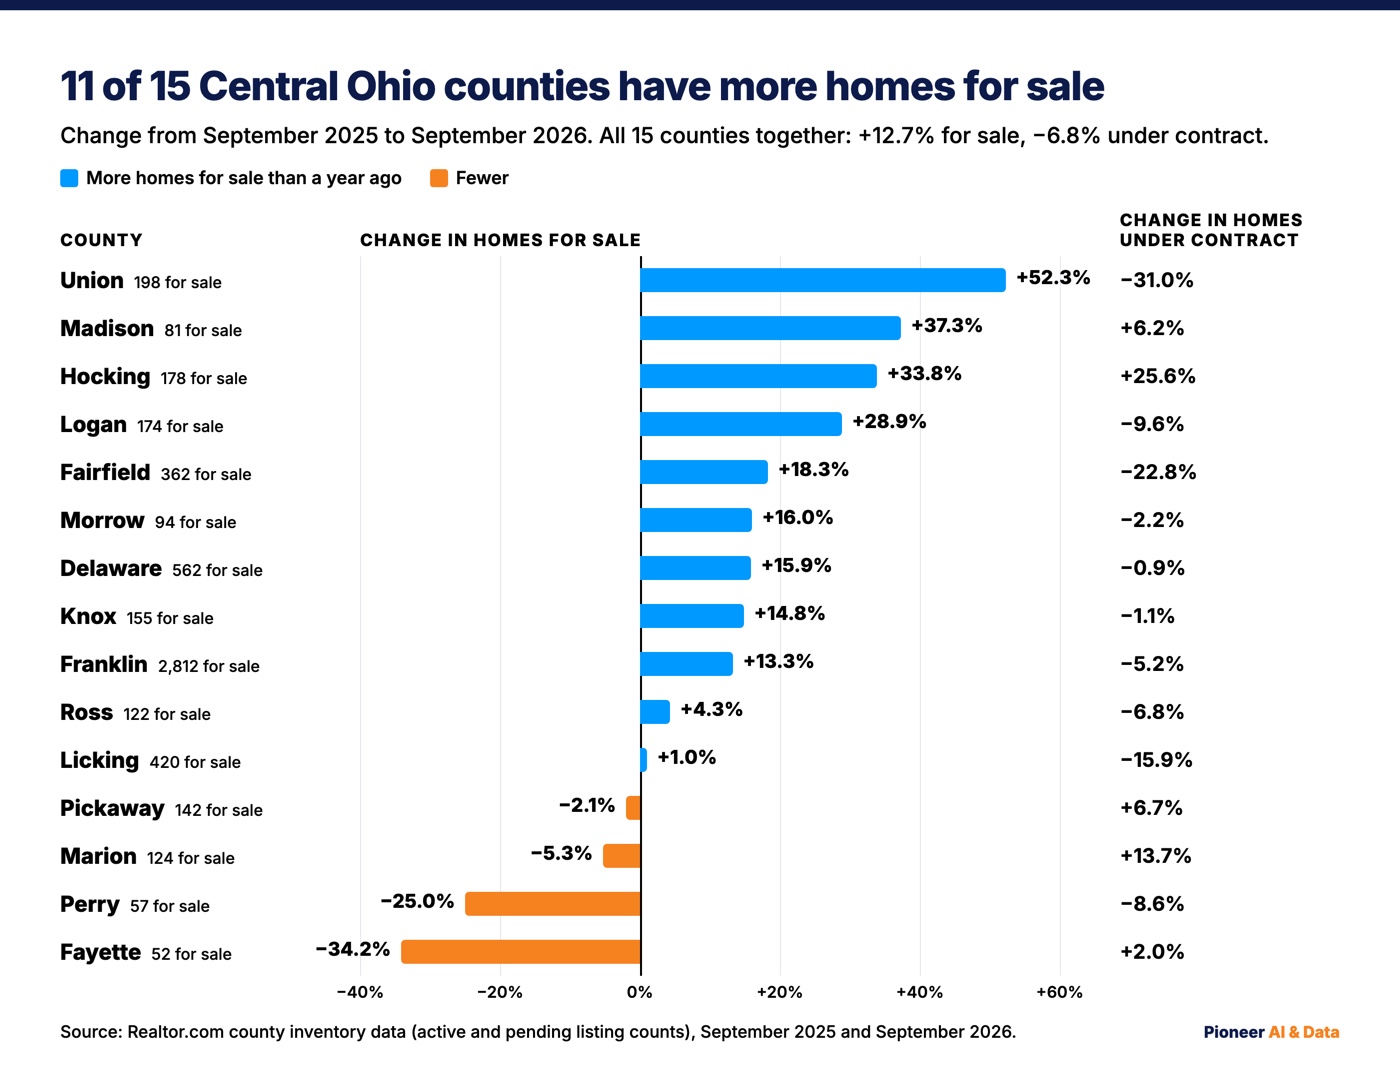
Eleven of Central Ohio's 15 counties had more homes for sale in September 2026 than in September 2025, and four had fewer.
| County | Median list price | vs. Sep 2025 | Homes for sale | vs. Sep 2025 | Under contract | vs. Sep 2025 | Median days on market, 2025 to 2026 | Listings with a price cut, 2025 to 2026 |
|---|---|---|---|---|---|---|---|---|
| Delaware | $588,175 | +6.5% | 562 | +15.9% | 338 | -0.9% | 48 to 49 | 28.1% to 27.3% |
| Fairfield | $417,500 | -1.2% | 362 | +18.3% | 203 | -22.8% | 46 to 51 | 26.2% to 28.3% |
| Fayette | $242,425 | -1.1% | 52 | -34.2% | 50 | +2.0% | 49 to 38 | 32.6% to 24.9% |
| Franklin | $314,950 | -5.4% | 2,812 | +13.3% | 1,489 | -5.2% | 43 to 46 | 30.3% to 30.2% |
| Hocking | $499,725 | -2.7% | 178 | +33.8% | 49 | +25.6% | 58 to 76 | 29.3% to 24.1% |
| Knox | $399,950 | +11.9% | 155 | +14.8% | 93 | -1.1% | 52 to 42 | 21.7% to 20.8% |
| Licking | $399,450 | -0.1% | 420 | +1.0% | 238 | -15.9% | 50 to 50 | 25.1% to 24.0% |
| Logan | $287,400 | -11.7% | 174 | +28.9% | 75 | -9.6% | 55 to 53 | 28.9% to 28.6% |
| Madison | $397,708 | +7.9% | 81 | +37.3% | 69 | +6.2% | 40 to 43 | 20.5% to 24.3% |
| Marion | $219,875 | +1.7% | 124 | -5.3% | 83 | +13.7% | 38 to 39 | 29.2% to 22.4% |
| Morrow | $459,200 | +19.9% | 94 | +16.0% | 45 | -2.2% | 50 to 49 | 30.0% to 26.3% |
| Perry | $269,925 | -18.2% | 57 | -25.0% | 32 | -8.6% | 70 to 63 | 26.0% to 34.1% |
| Pickaway | $387,400 | +4.5% | 142 | -2.1% | 96 | +6.7% | 46 to 43 | 22.7% to 29.5% |
| Ross | $289,675 | +6.8% | 122 | +4.3% | 69 | -6.8% | 46 to 54 | 21.4% to 25.6% |
| Union | $567,200 | +1.4% | 198 | +52.3% | 100 | -31.0% | 46 to 49 | 18.6% to 30.5% |
Realtor.com's file marks Logan County's and Perry County's September 2026 rows with a data-quality flag, and Fayette County's and Perry County's September 2025 rows, so treat the Fayette, Logan, and Perry rows as softer than the rest.
- Union County had the biggest rise in homes for sale and the biggest fall in homes under contract of all 15 counties. Its homes for sale went from 130 to 198, up 52.3%, while its pending listings went from 145 to 100, down 31.0%.
- Hocking County was the slowest market in the region at a median of 76 days on market, up 18 days from a year earlier, the biggest rise of the 15. Hocking also had 33.8% more homes for sale.
- Fairfield and Licking counties had the next-biggest falls in homes under contract, down 22.8% and 15.9%. Fairfield's median days on market rose from 46 to 51, while Licking's held at 50.
- Madison County had 37.3% more homes for sale, 81 against 59.
- Fayette County was the fastest market in the region at 38 days, 11 fewer than a year earlier, and it had 34.2% fewer homes for sale.
- Knox County got faster. Its median days on market fell from 52 to 42, and its median list price rose 11.9%.
- Marion County had the lowest median list price in the region, $219,875, and 13.7% more homes under contract than a year earlier.
Read the small counties with care. Morrow County's median list price rose 19.9% on 94 listings, and Perry County's fell 18.2% on 57. In a county that size, a handful of listings can move the median.
Why Central Ohio housing reports print different numbers
Central Ohio housing reports print different numbers because they measure different things over different ground, and none of the three below is wrong.
| September 2026 | Source | Homes for sale | Under contract | Median price | Days on market |
|---|---|---|---|---|---|
| Columbus metro | Realtor.com | 4,913 | 2,671 | $374,950 list | 48 |
| 15 MORPC counties | Realtor.com, summed by us | 5,533 | 3,029 | by county, above | by county, above |
| Central Ohio MLS area | Columbus REALTORS | 6,530 | 2,448 | $334,250 sale | 33 until sale |
Start with price, the easiest gap to explain. Realtor.com's $374,950 is the median asking price of homes listed for sale, and Columbus REALTORS' $334,250 is the median price of homes that actually sold.
The counts differ because the ground differs. Our region is MORPC's 15 counties, and Realtor.com's metro figure covers the Columbus metro area. The Columbus REALTORS figures cover the whole Columbus & Central Ohio Regional MLS, the shared listing database local agents use: all of 8 counties and parts of 12 more, according to the statistics report linked from the release. Five of those 20 counties sit outside the MORPC region, and 7 of the 15 MORPC counties are covered only in part. Realtor.com's count of homes for sale, by its own definition, leaves out homes already under contract.
Days on market differ because the measures differ. Realtor.com's figure is the median number of days listings spent on the market during the month, from list date to closing, pending, or off-market date, depending on what data exists. The Columbus REALTORS report gives 33 days on market until sale, up from 30. The association's figure covers homes that sold and does not say whether it is a median, so the two numbers do not line up directly.
The direction is the part all three agree on. The three counts of homes for sale rose from a year earlier, by 12.7%, 13.8%, and 12.3%. The three counts of homes under contract fell, by 6.8%, 7.5%, and 12.7%.
Numbers can also change after they are published. Zillow's index for Franklin County read $296,381 for August 2026 in the file the August report used. In October's download of the same file, August 2026 reads $291,902. The year-over-year change is 0.1% in both files, because the year-earlier months moved down with it. Keeping each month's output, not only the latest download, is how a revision to a published number gets noticed at all.
What a 7.40% mortgage rate does to the same house
At Freddie Mac's October 15, 2026 average of 7.40% for a 30-year fixed loan, the Columbus metro's median-priced listing costs about $226 a month more to finance than it would have at the 6.27% average a year earlier.
The arithmetic: take the metro's median list price of $374,950, put 20% down, and borrow the rest for 30 years. Principal and interest come to about $2,077 a month at 7.40% and about $1,851 at 6.27%. The gap works out to about $2,700 a year for the same house at the same price, before taxes and insurance.
Freddie Mac's weekly average rose in every week of September, from 6.71% on September 3 to 7.03% on September 24. The September 24 reading was the first at or above 7% since January 2025. The rate reached 7.40% on October 8 and held there on October 15, and the September report used 7.40% when it ran on October 20.
How our September forecast graded, and the call for October
August's forecast for September missed county median list prices by 3.4% on average, and it called the direction of the move right in only 6 of 15 counties.
- Median days on market: the average miss was 8.0%, and the direction was right in 11 of 15 counties.
- Homes for sale: the average miss was 8.4%, and the direction was right in 6 of 15 counties.
- Ranges: 42 of the 45 county forecasts landed inside their published 80% range, the band the forecast expects the real number to land in four times out of five.
The August issue published a September call for Franklin County before the data existed. Here is how it landed:
- Median list price: called at about $323,300, landed at $314,950. The list price call missed by 2.7% and in the wrong direction, because it expected a rise from August's $318,500.
- Median days on market: called at 45, landed at 46.
- Homes for sale: called at about 2,740, landed at 2,812.
All three Franklin County numbers landed inside their 80% ranges.
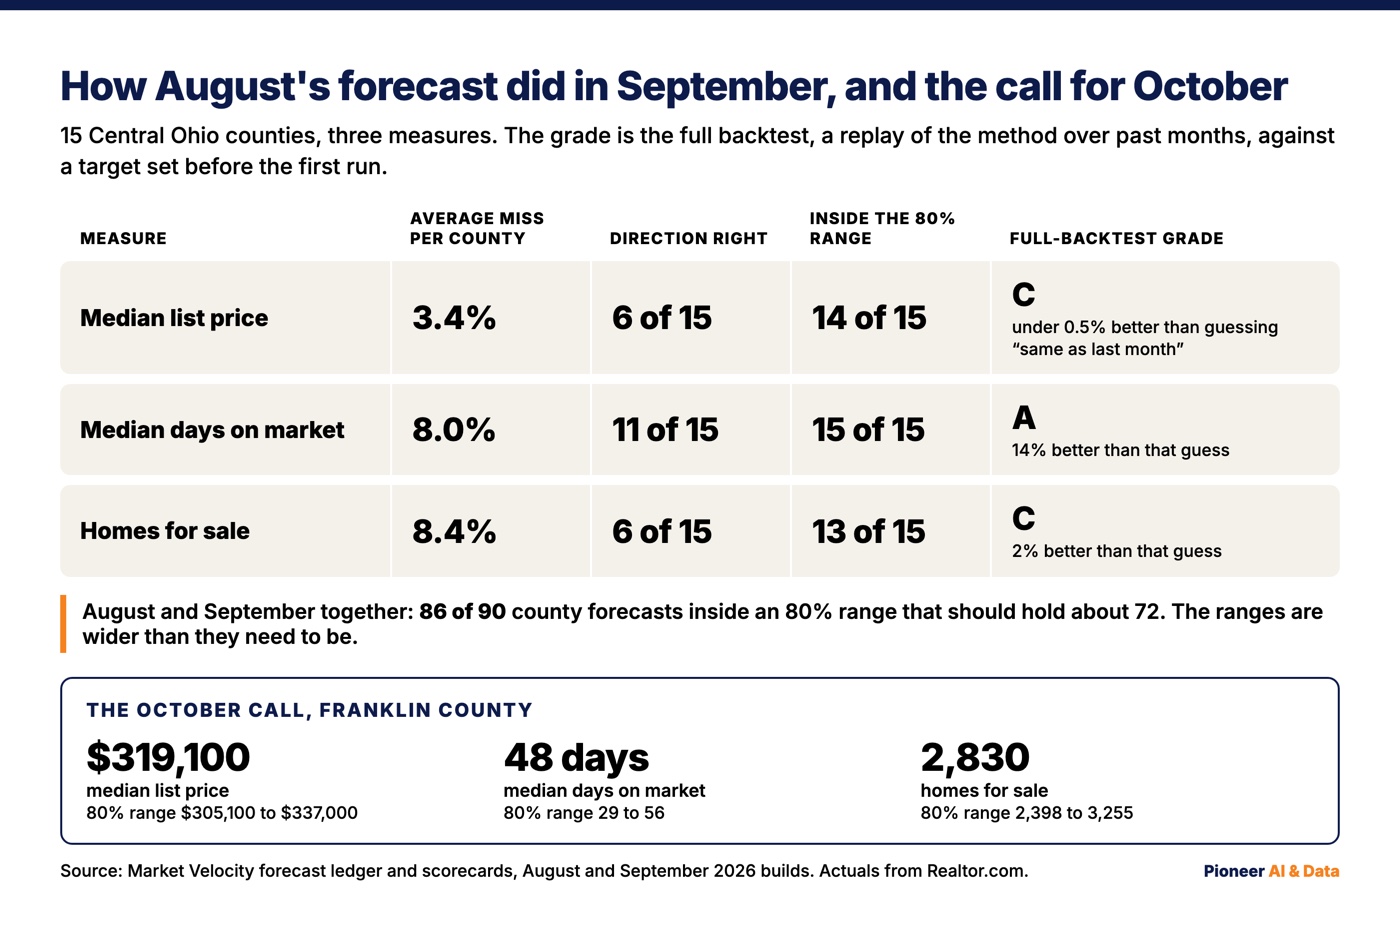
Last month I wrote that if the ranges kept catching nearly everything, they were wider than they need to be. Across August and September, 86 of 90 county forecasts landed inside an 80% range, and a range that size should have caught about 72 of them. An honest 80% range misses about one time in five. These missed about one time in 22, which is safe and not very informative.
The longer record is still the weak spot on list prices. A backtest replays the forecasting method over past months to see how it would have done. Over the full backtest, the list price forecast now beats the simplest possible guess, that next month will look like this month, by less than half of one percent. The list price grade moved from a D to a C on that edge, against a target, set before the first run, of beating the guess by 10%. The days-on-market forecast beats the simple guess by 14% and grades an A. The homes-for-sale forecast beats it by 2% and grades a C. I wrote about why the simple guess is so hard to beat on list prices in its own post.
Here is the October call for Franklin County, written down before the data exists:
- Median list price: about $319,100, with an 80% range of $305,100 to $337,000
- Median days on market: 48, with a range of 29 to 56
- Homes for sale: about 2,830, with a range of 2,398 to 3,255
The October report will grade this call against what actually happens, whether it lands or not.
Want this run for your business?
Book a free discovery call. We map where AI fits, show you the numbers, and point you to the right plan. No pressure, no jargon.
Book a Discovery Call →