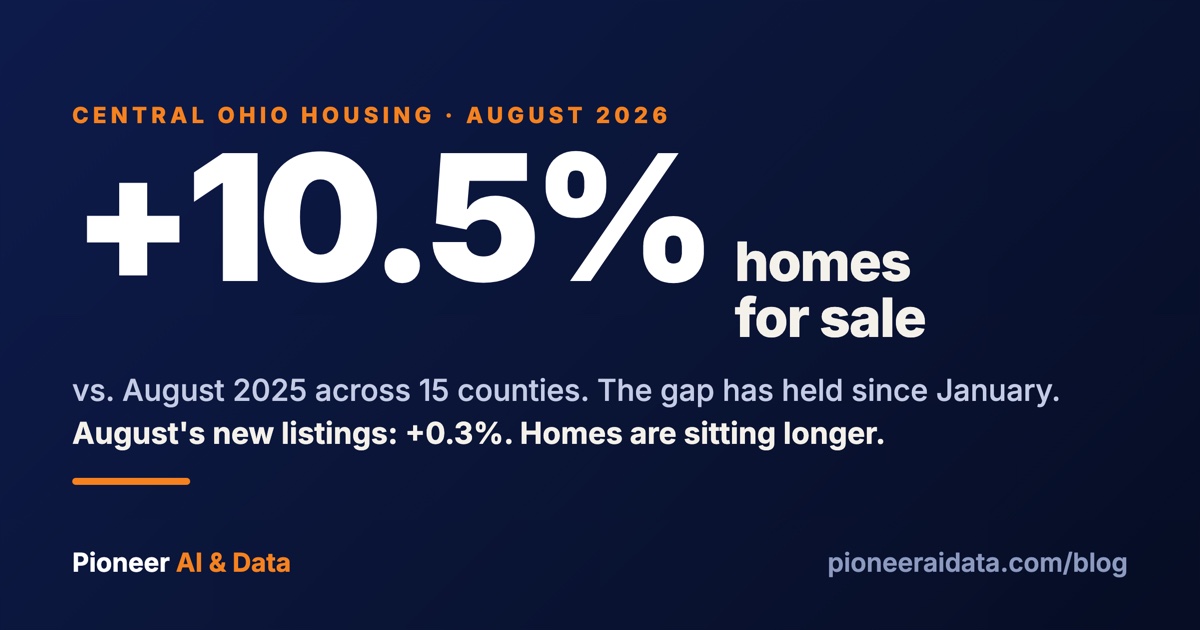
The Central Ohio housing market had 10.5% more homes for sale in August 2026 than in August 2025, and the gap is not new. Homes for sale have run above last year's level every month since January. August's new listings were almost exactly last year's. Central Ohio homes are staying on the market longer, and prices are holding about where they were.
The county figures here come from the Market Velocity report, which I build every month for the 15 counties of the Mid-Ohio Regional Planning Commission (MORPC) region. The report runs on free public data, mostly Realtor.com listing counts and Zillow's home value index. Pioneer AI & Data builds the same kind of pipeline for businesses that want a report that runs itself every month. Each issue also forecasts the next month and grades the previous call in public, and August's grade is near the bottom of this post.
What the Central Ohio housing market did in August 2026
In August 2026 the Central Ohio housing market had more homes for sale than a year earlier and slightly fewer sales, and prices held steady.
- Homes for sale: 5,335 active listings across the 15 counties, up from 4,828 in August 2025. Realtor.com's count for the Columbus metro was 4,705, up 10.9%. Realtor.com's national count of active listings was up 3.6%.
- Prices: Realtor.com's median list price for the Columbus metro was $379,900, down 0.1% from a year earlier. Columbus REALTORS reported a central Ohio median sale price of $345,500 for August, up 2.2%.
- Sales: Columbus REALTORS counted 2,749 closed sales in August, down 2.5% from August 2025.
- Speed: The median Columbus metro listing spent 44 days on the market in August, 7.3% longer than a year earlier. Realtor.com's national median was 60 days.
Sellers who closed in August got 96.9% of their original list price on average, according to Columbus REALTORS, against 97.2% a year earlier. Central Ohio prices are holding. Sale prices are up a little and list prices are flat, while sellers give up about three-tenths of a point more at the closing table than they did last year.
The extra inventory has been there all year, and it is selling slower
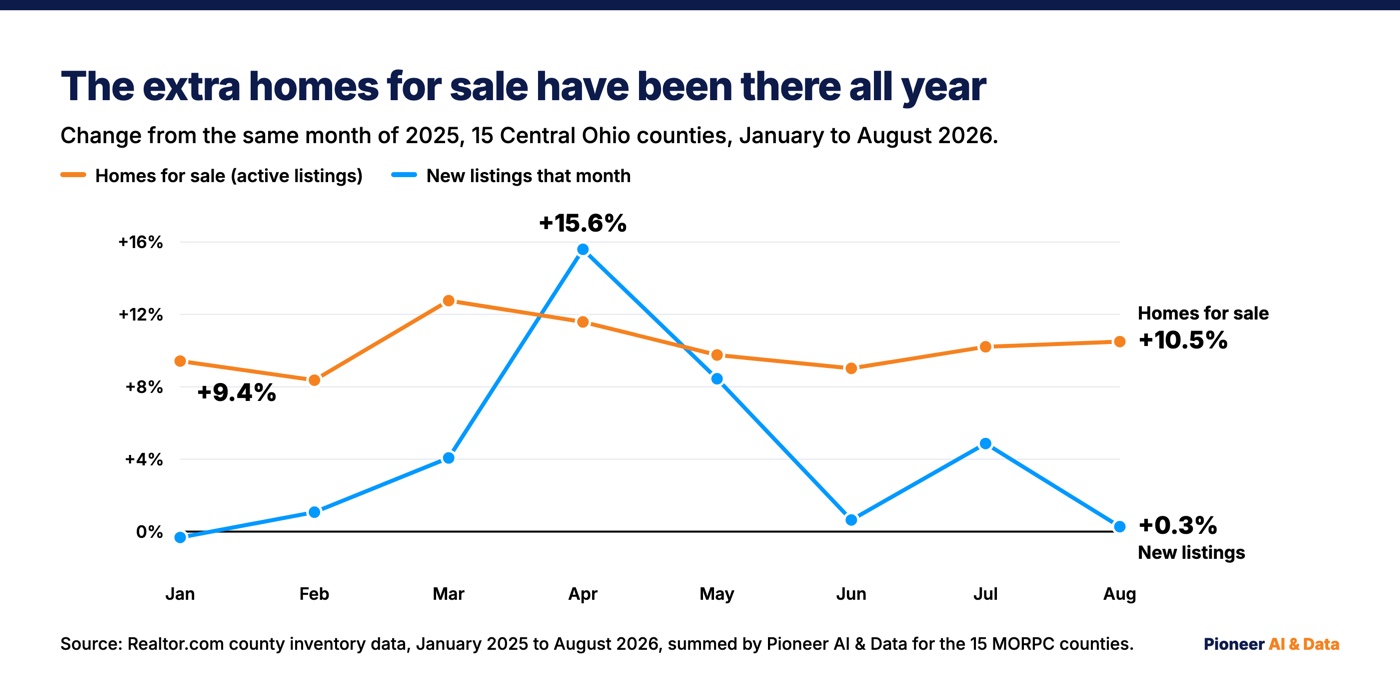
Central Ohio started 2026 with more homes for sale than a year earlier and has kept that gap all year. In August, homes on the market were also taking longer to sell.
- All year: in every month from January through August, the 15 counties had between 8.4% and 12.8% more homes for sale than in the same month of 2025. January was already 9.4% higher.
- More sellers in the spring: from January through August, 23,472 homes came on the market across the 15 counties, against 22,414 in the same months of 2025, up 4.7%. April alone was up 15.6%.
- A flat August: new listings were 2,944 against 2,936, up 0.3%. Pending listings, the homes under contract but not yet closed, were 3,354 against 3,334, up 0.6%.
- Slower: median days on market rose from a year earlier in 10 of the 15 counties.
Columbus REALTORS' August figures point the same way. The association reported new listings down 4.4% in August while its count of homes for sale rose 6.8% to 6,124, the highest August level in recent years. It also counted 20,006 closed sales for the year through August, up 2.3%, so buyers have not disappeared.
Franklin County: asking prices down, home values flat
In Franklin County, the median asking price fell 4.9% from a year earlier while Zillow's estimate of the typical home's value held flat.
- Franklin County had 2,700 active listings in August, just over half of the region's 5,335, and up 12.5% from 2,399 a year earlier.
- Franklin County's median list price was $318,500, down from $335,000 in August 2025.
- Zillow's home value index for Franklin County was $296,381, up 0.1% from $296,066.
- The median Franklin County listing spent 43 days on the market, against 41 a year earlier.
- Franklin County's new listings were up 5.2% in August and 8.7% for the year through August, so in the region's biggest county more owners are listing.
A median list price is the middle of whatever happens to be for sale that month. Zillow's home value index measures the typical home value across the whole county. When the median list price and the value index split like this, the list price is describing the listings, not the county's homes as a whole. The homes listed in Franklin County this August were priced lower, or were different homes, than the ones listed last August. By Zillow's index, the typical Franklin County home did not lose 5% of its value; it gained 0.1%.
Zillow's index rose year over year in all 15 counties, from 0.1% in Franklin to 4.9% in Knox. Median list prices fell in six of the 15.
Central Ohio county by county: where homes for sale rose and fell
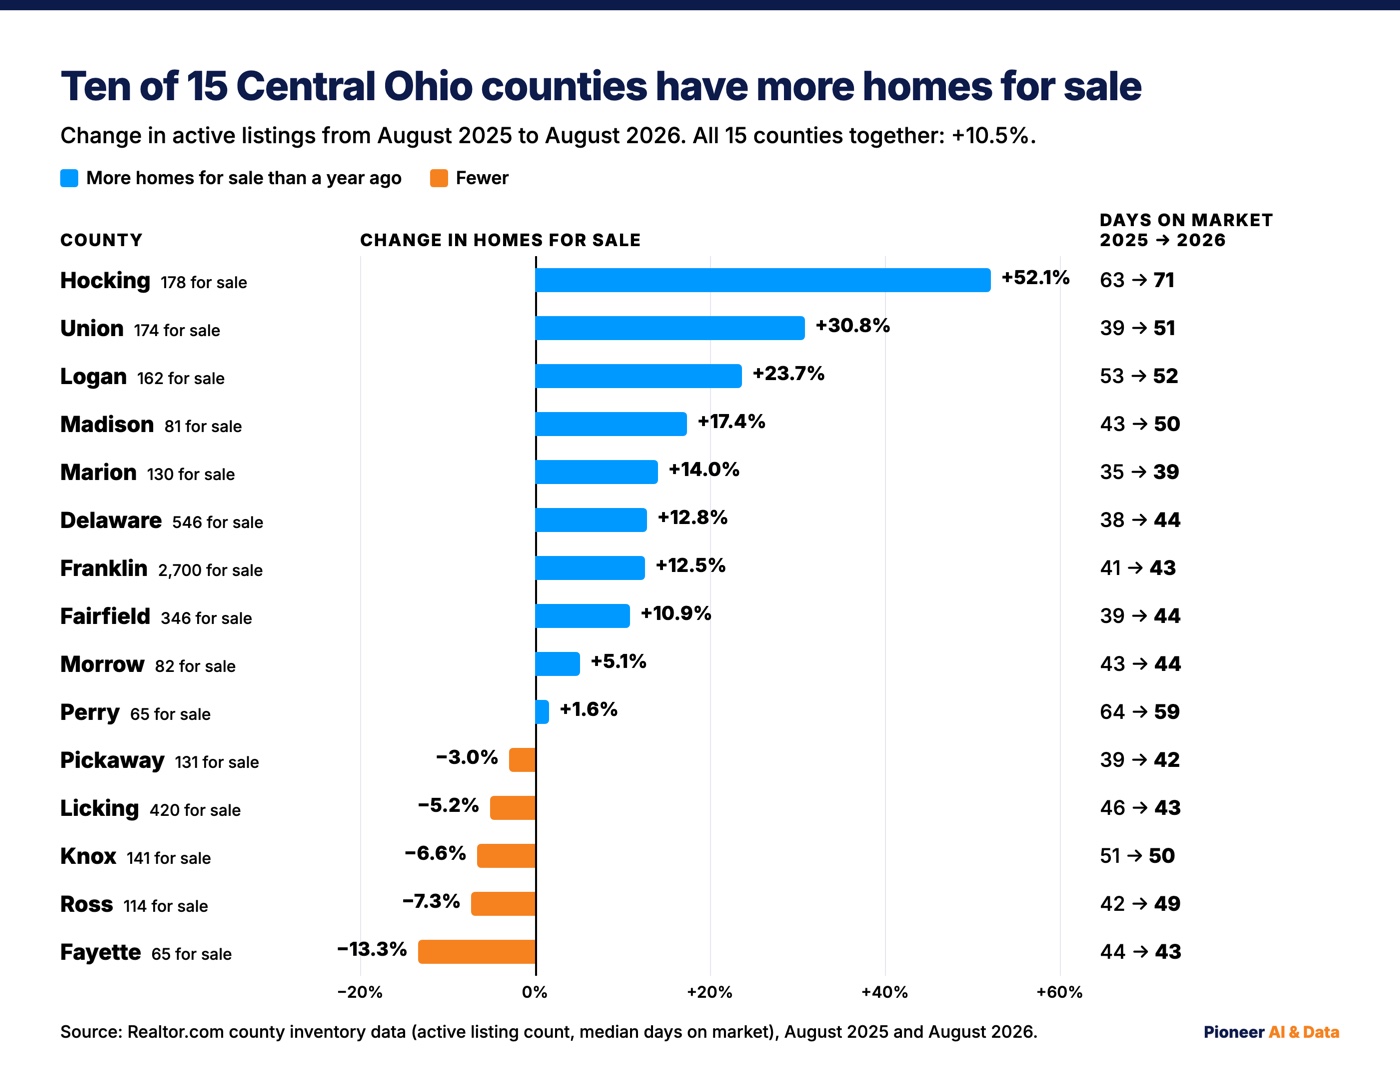
Ten of Central Ohio's 15 counties had more homes for sale in August 2026 than in August 2025, and five had fewer.
| County | Median list price | vs. Aug 2025 | Homes for sale | vs. Aug 2025 | Median days on market, 2025 to 2026 |
|---|---|---|---|---|---|
| Delaware | $599,872 | +5.9% | 546 | +12.8% | 38 to 44 |
| Fairfield | $429,888 | +4.2% | 346 | +10.9% | 39 to 44 |
| Fayette | $239,900 | -5.9% | 65 | -13.3% | 44 to 43 |
| Franklin | $318,500 | -4.9% | 2,700 | +12.5% | 41 to 43 |
| Hocking | $499,900 | -5.2% | 178 | +52.1% | 63 to 71 |
| Knox | $398,750 | +10.8% | 141 | -6.6% | 51 to 50 |
| Licking | $399,900 | -2.4% | 420 | -5.2% | 46 to 43 |
| Logan | $284,950 | -13.6% | 162 | +23.7% | 53 to 52 |
| Madison | $379,900 | +1.6% | 81 | +17.4% | 43 to 50 |
| Marion | $199,900 | +5.3% | 130 | +14.0% | 35 to 39 |
| Morrow | $472,400 | +24.3% | 82 | +5.1% | 43 to 44 |
| Perry | $299,900 | -9.1% | 65 | +1.6% | 64 to 59 |
| Pickaway | $388,500 | +4.2% | 131 | -3.0% | 39 to 42 |
| Ross | $299,900 | +9.0% | 114 | -7.3% | 42 to 49 |
| Union | $599,000 | +8.9% | 174 | +30.8% | 39 to 51 |
Realtor.com's file marks Logan County's August row with a data-quality flag, the only one of the 15, so read that row with extra care.
- Union County had the biggest jump in days on market of all 15 counties, from 39 days to 51, and the second-biggest rise in homes for sale after Hocking, from 133 to 174, up 30.8%.
- Delaware County had 12.8% more homes for sale and a median of 44 days on the market, up from 38.
- Hocking County was the slowest market in the region at 71 days, with 52.1% more homes for sale than a year earlier.
- Knox County got tighter. It had 6.6% fewer homes for sale, its median list price rose 10.8%, and its median days on market held at about 50.
- Ross County had 7.3% fewer homes for sale, but not because homes sold faster. Its new listings fell from 64 to 48, and its median days on market rose from 42 to 49. Its median list price rose 9.0%.
- Licking County had 5.2% fewer homes for sale, and its median listing spent 43 days on the market, three fewer than a year earlier.
- Marion County was the fastest market in the region at 39 days, with the lowest median list price, $199,900.
Read the small counties with care. Morrow County's median list price jumped 24.3%, but on 82 listings. In a county that size, a handful of expensive listings can move the median.
Why two Central Ohio housing reports can print different numbers
Two honest reports on the same month can disagree because they measure different things over different ground.
| August 2026 | Source | Homes for sale | Median price | Median days on market |
|---|---|---|---|---|
| Columbus metro | Realtor.com | 4,705 | $379,900 list | 44 |
| 15 MORPC counties | Realtor.com, summed by us | 5,335 | by county, above | by county, above |
| Central Ohio | Columbus REALTORS | 6,124 | $345,500 sale | 30 |
The price gap is the easiest to explain. Realtor.com's $379,900 is the median asking price of homes listed for sale, and Columbus REALTORS' $345,500 is the median price of homes that actually sold.
The counts differ because the ground differs. Our region is the Mid-Ohio Regional Planning Commission's 15 counties, Realtor.com's metro figure covers the Columbus metro area, and Columbus REALTORS reports on "central Ohio" without listing the counties. Realtor.com also counts only active listings and leaves out homes already under contract.
Days on market differ because the measures differ. Realtor.com's median counts the days listings spent on the market during the month, measured from the list date to closing, pending, or removal, depending on what data exists. The Columbus REALTORS release gives a median of 30 days, one day longer than a year earlier, without saying how it is measured, so the two numbers do not line up directly.
All three counts of homes for sale went up from a year earlier. None of the three numbers is wrong; each answers a different question, and a report that does not say which question it answers is the one to be careful with. Most of data work, by the way, is making sure two numbers with the same name are actually the same thing.
What higher mortgage rates do to the same house
At Freddie Mac's September 17, 2026 average of 6.95% for a 30-year fixed loan, the Columbus metro's median-priced listing costs about $139 a month more to finance than it would have at last September's 6.26%.
The arithmetic: take the metro's median list price of $379,900, put 20% down, and borrow the rest for 30 years. Principal and interest come to about $2,012 a month at 6.95% and about $1,873 at 6.26%. The gap works out to about $1,660 a year for the same house at the same price, before taxes and insurance.
Mortgage rates climbed through the summer of 2026. Freddie Mac's weekly average was 6.43% in the first week of July and 6.76% the week before the latest reading. The August report ran on the morning of September 17 and used 6.76%, the latest weekly rate available at the time.
How our August forecast graded, and the call for September
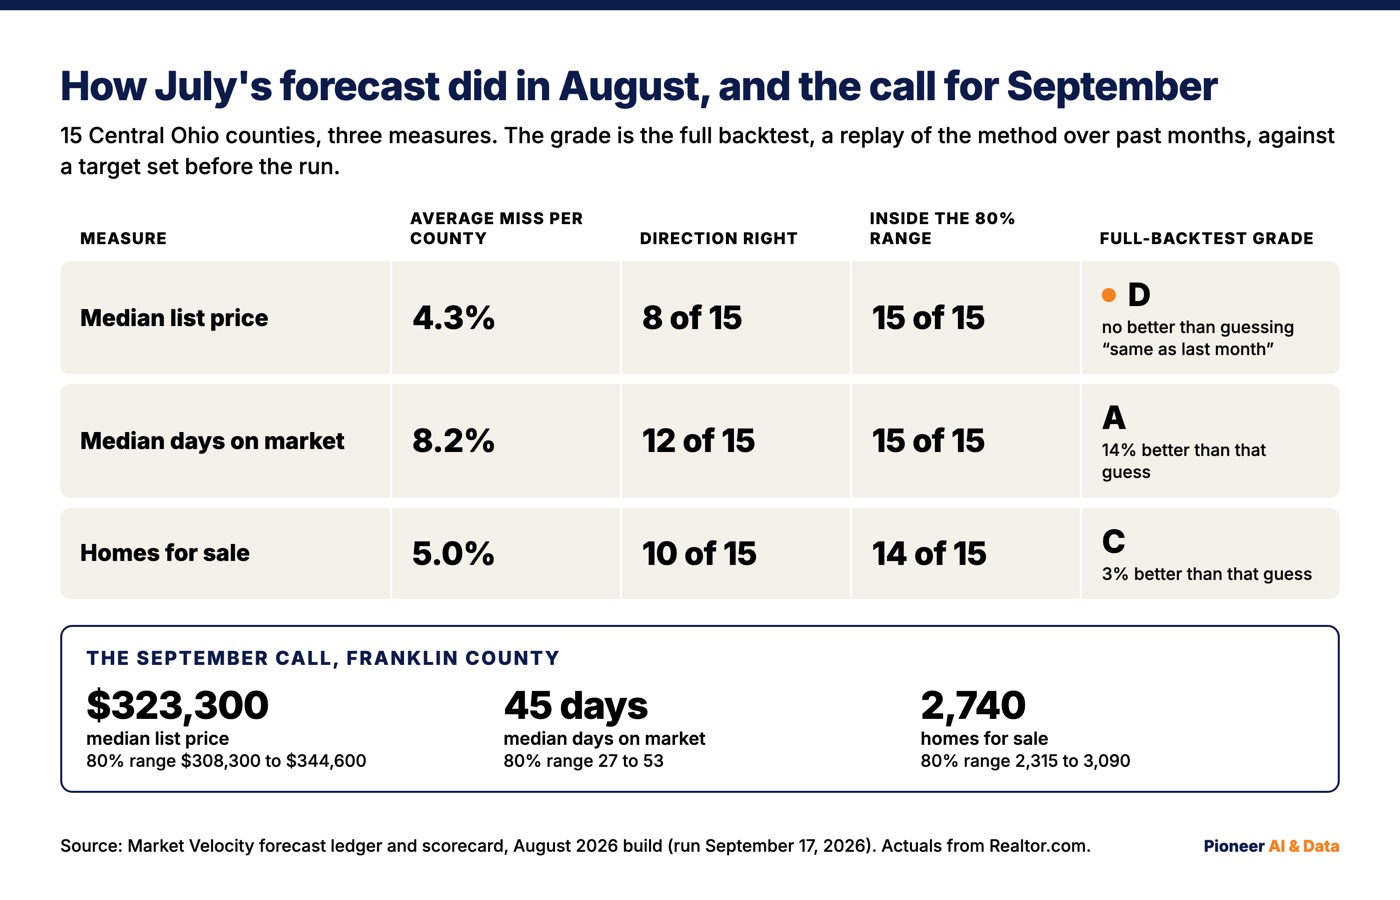
July's forecast for August missed county median list prices by 4.3% on average, and it called the direction of the move right in only 8 of 15 counties.
- Median days on market: the average miss was 8.2%, and the direction was right in 12 of 15 counties.
- Homes for sale: the average miss was 5.0%, and the direction was right in 10 of 15 counties.
- Ranges: 44 of the 45 county forecasts landed inside their published 80% range, the band the forecast expects the real number to land in four times out of five.
Landing 44 of 45 inside an 80% range sounds good, and it probably is not. An 80% range should miss about one time in five. One month is not a track record, and August is the first month the scorecard recorded range hits at all. If it keeps happening, the ranges are wider than they need to be. Wide ranges are safe, and they are not very informative.
The longer record is less flattering on list prices. A backtest replays the forecasting method over past months to see how it would have done. Over the full backtest, the list price forecast scores no better than the simplest possible guess, which is that next month will look like this month, and it grades a D against a target set before the run. The days-on-market forecast beats that simple guess by 14% and grades an A. The homes-for-sale forecast beats it by 3% and grades a C. I wrote about why the simple model keeps winning on list prices, and August did not change that.
Here is the September call for Franklin County, written down before the data exists:
- Median list price: about $323,300, with an 80% range of $308,300 to $344,600
- Median days on market: 45, with a range of 27 to 53
- Homes for sale: about 2,740, with a range of 2,315 to 3,090
The September report will grade this call against what actually happens, whether it lands or not. Past issues of the report, with one page per county, are in the Market Velocity archive.
Want this run for your business?
Book a free discovery call. We map where AI fits, show you the numbers, and point you to the right plan. No pressure, no jargon.
Book a Discovery Call →