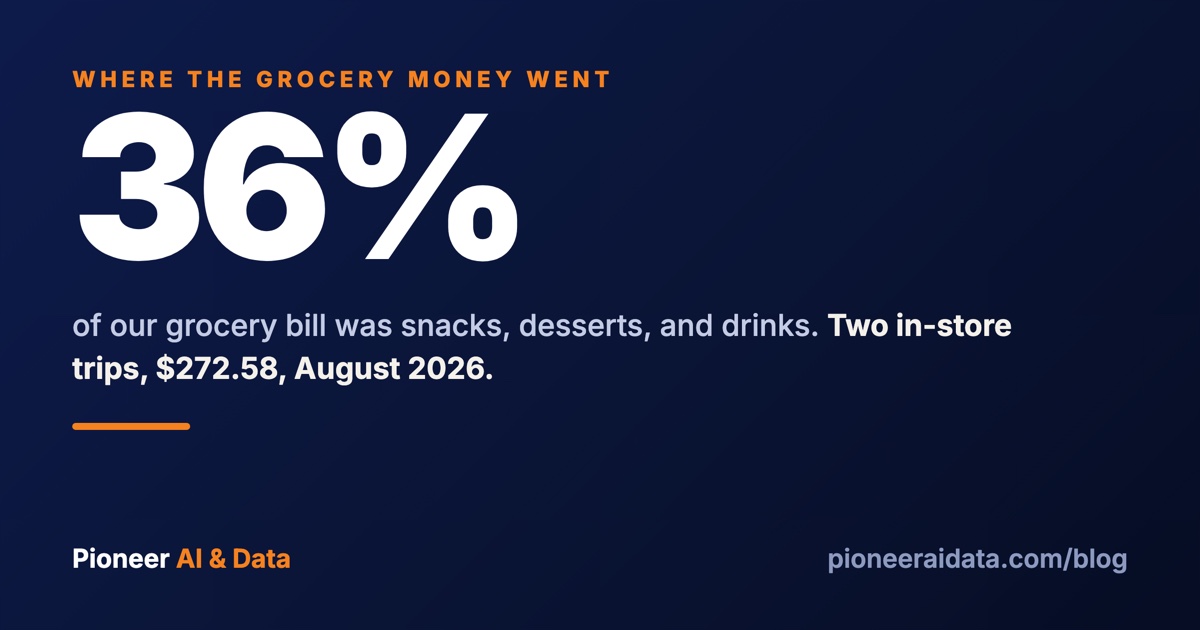
We ran our grocery receipts through AI and asked it one question: where does the money actually go. On two in-store trips two weeks apart, totaling $272.58, about $97 was snacks, desserts, and drinks. That is roughly 36% of the bill. Fruit was $41. Everything else on the receipt, dinner ingredients included, came to $135.
Nobody in the house would have guessed a third. That gap is the useful part. Grocery spending is not a budgeting problem for most families. It is a visibility problem, and visibility is the cheapest thing AI does well. It is also the kind of work we do for clients, usually pointed at supply orders or vendor invoices instead of a cart.
What four receipts actually said
Four receipts said the same thing. Snacks, desserts, and drinks were the largest single category we could name on the receipt, and it was not close. Here is the breakdown of the two August trips, $272.58 combined:
| Category | Spend | Share |
|---|---|---|
| Snacks, desserts, and drinks | $97 | 36% |
| Fruit | $41 | 15% |
| Everything else, dinners included | $135 | 49% |
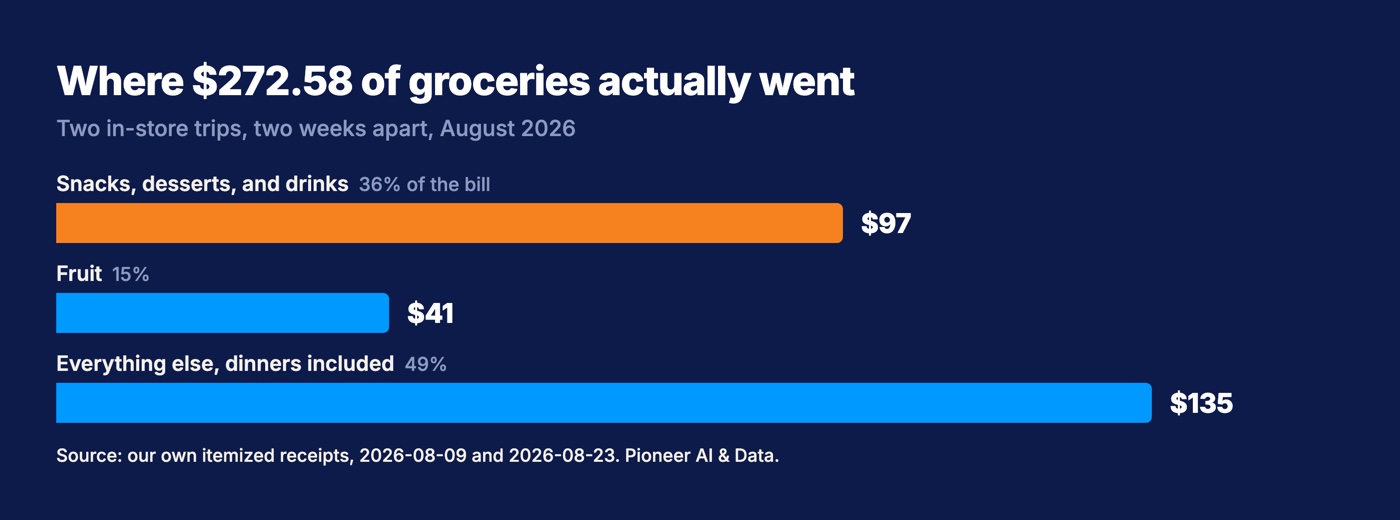
Inside that $97: $48 of chips, crackers, popcorn, and cookies. $27 across seven tubs and packs of frozen dessert, bought two weeks apart. $22 in aloe drinks, sparkling water, and chocolate milk.
The bigger trip from earlier in the summer, $257.09 across 54 items, had the same shape and a second finding. Fruit was the largest single category at about $63, roughly 25%. Fine by us, because the kids genuinely eat it. But about $14 of that was cut-fruit and berry cups from the prepared case. We were paying a prep markup on fruit that gets eaten either way.
Not one of those items is shocking on its own. There is no villain on the receipt, and that is why the pattern went years without anyone catching it.
The coupons were working. The cart was the problem.
The discounts were never the issue. Those same receipts carried $20.18 and $13.65 in coupons and loyalty savings, and the June trip carried $29.95. The clipping was fine. The composition of the cart was the problem, and no coupon fixes composition.
The gap between price and composition is the most useful thing the exercise turned up, and it generalizes well past groceries. Most people optimize the price of what they buy. Almost nobody audits the mix of what they buy. AI is good at the second one because it does not get bored reading 51 line items and it does not have an opinion about whose snacks those are.
One more line that only showed up once both receipts sat side by side: the warehouse club sells Honeycrisp apples in 4 lb bags at $6.59, which works out to $1.65/lb. The grocery store's loose Honeycrisp ran $2.69 to $2.78/lb. At about 3 lb a week in this house, moving apples to the monthly bulk run saves a little over $3 a week on identical fruit. Small, but it repeats 52 times a year.
The aisles cost more than the list
Walking the store is the expensive habit. Our in-store trips averaged $136.29. The first list the system built for a pickup order came to about $54 for 15 items, because it was assembled from a meal plan instead of from end caps. At the register it rang up at $37.88 once everything was shopped and weighed.
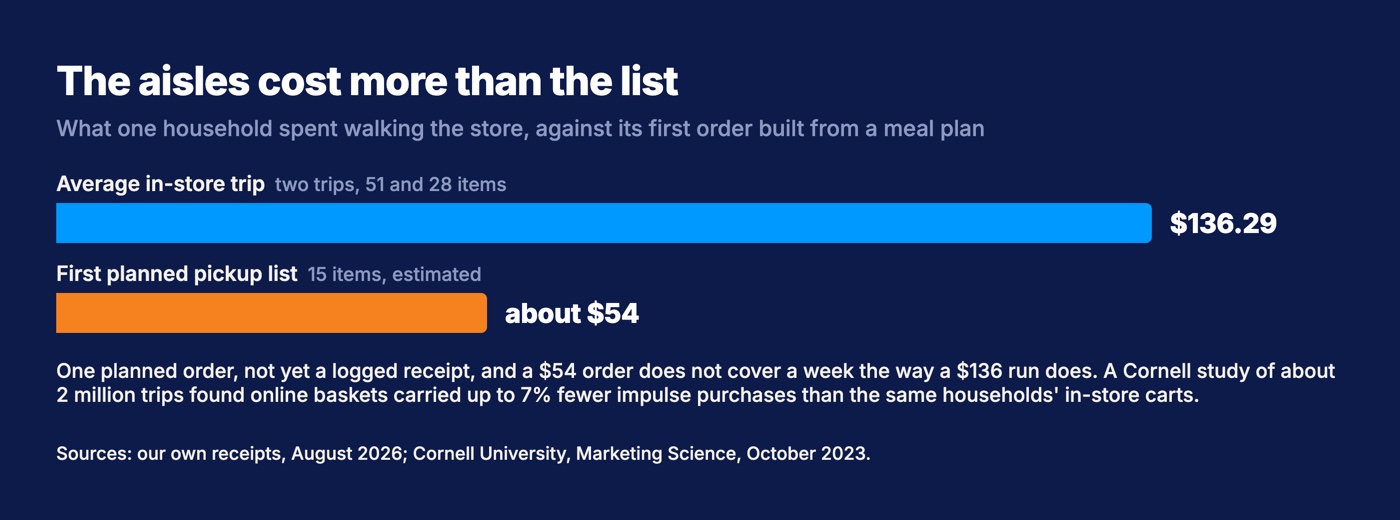
One caveat, and it is a real one. That is a single planned order against a two-trip average, and a $38 order does not cover a week the way a $136 run does. It is a direction, not a result. We will publish the real before-and-after once there are enough logged receipts to mean something.
The research is less hedged than we are. A Cornell University study of about 2 million shopping trips from 4,388 participants over three years, published in Marketing Science in October 2023, found that the same households' online baskets carried up to 7% fewer impulse purchases (candy, baked goods, chips) than their in-store carts.
Planning also beats willpower on its own. In a 2020 study of online grocery trips, people randomly assigned to write a shopping list bought fewer items than people who were not asked to write one, and as one of the researchers later explained, the people who set a spending goal without writing a list bought about as much as the people with no plan at all. A budget in your head is not a plan.
The same Cornell study names the honest cost of shopping this way. Online baskets carried 13% fewer fresh vegetables, and successive online orders repeated more than twice as many items as successive in-store trips. Pickup makes you efficient and it makes you boring. So the plan has to rotate meals on purpose, and deciding that rotation is still a person's job.
A snack-heavy grocery bill is normal, which is why it hides
Our 36% is not unusual. The Bureau of Labor Statistics puts average US household spending on food at home at $6,224 in 2024, and $2,447 of that, about 39%, sits in the category it calls "other food at home": sugar and sweets, fats and oils, miscellaneous foods, and nonalcoholic beverages. That bucket is broader than ours, so treat it as confirmation of the shape rather than the same measurement. A third of the grocery bill going to something that is not a meal is normal in this country.
Three numbers worth having in your head before you judge your own:
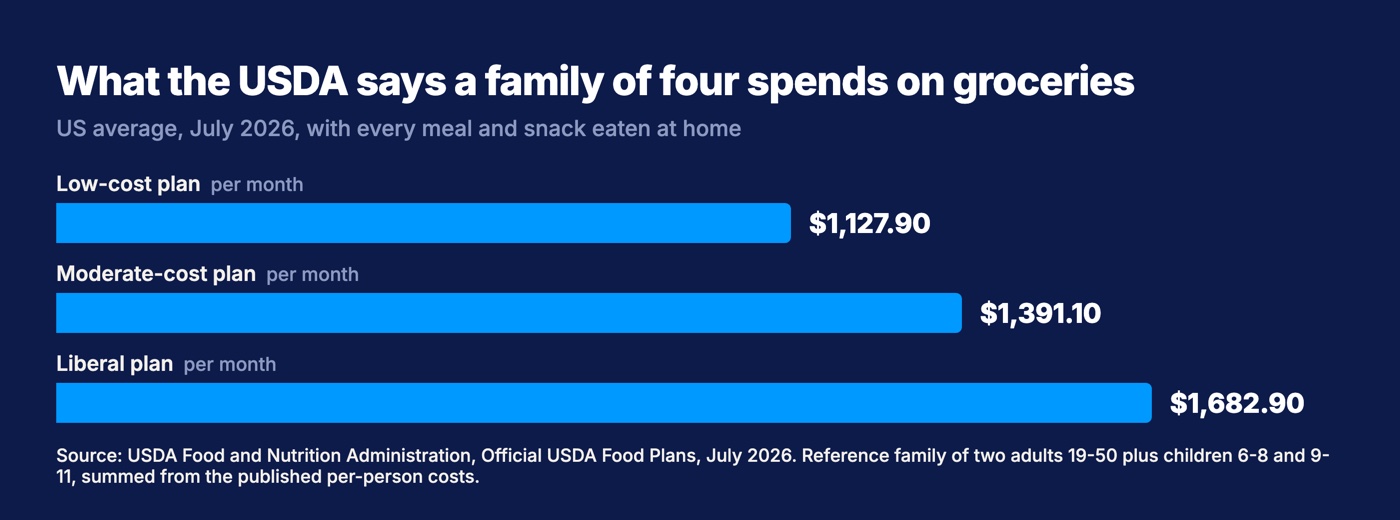
- The USDA's official food plans for July 2026 put a family of four at $1,127.90 a month on the low-cost plan, $1,391.10 on the moderate plan, and $1,682.90 on the liberal plan, with every meal eaten at home. That is the USDA reference family: two adults aged 19 to 50 and children aged 6 to 8 and 9 to 11, added up from the published per-person costs.
- Food-at-home prices in July 2026 were 2.7% higher than a year earlier, and USDA's Economic Research Service forecasts a 2.5% rise across 2026, just under the 20-year average of 2.6%. Groceries are not spiking. They are compounding.
- Uneaten food costs the average US consumer $728 a year, or $14 a week, which works out to $2,913 a year for a household of four and about 11% of what they spend on food, according to an April 2025 EPA analysis. Over one third of food in this country is never eaten.
Groceries are one of the largest recurring lines in a household budget, they drift up every year on their own, and roughly a tenth of what a household spends on food buys food that gets thrown away. Nobody looks at a number like that closely, because looking at it closely is tedious. Tedious is what you hand to a machine.
How to run your own grocery receipts through AI this week
You need a phone camera and any AI chat tool. No app, no subscription, no spreadsheet skills.
- Gather four receipts. Two normal trips and one big one is enough to see a pattern. Photograph the paper, or download the itemized receipts from your store's account page, which is easier and more accurate.
- Ask for line items first, not advice. Have the AI transcribe every line with its price into a plain list. Check three or four lines against the paper yourself. If the transcription is wrong, everything downstream is wrong.
- Ask it to sort those lines into your categories. Not its categories. Ours were snacks and desserts, drinks, fruit, dinner ingredients, breakfast, household goods, and prepared food. Then ask for the dollar total and percentage of each.
- Ask what it would cut and what it would protect. The protect half matters. Fruit is 15% of our bill and it is staying, because the kids eat it. Cutting the wrong 15% is how a budget dies in week three.
- Change exactly one habit. Ours was ordering for pickup off a meal plan instead of walking the store. One habit that survives beats five that do not.
Two things to keep straight while you do it. Separate household goods from food before you judge the number: one $497.09 warehouse run of ours was about $350 of food and about $138 of paper towels, soap, laundry pacs, and a fan. And do not upload anything with your card number or loyalty account on it. Crop those off first.
If you want the finished version of what we built out of this, the Grocery Autopilot Starter kit is free: the weekly planning skill, the household templates, the receipt log, and the store price scripts, open source and yours to keep.
The same move works on your business
Point the same audit at your business spend and nothing about the exercise changes. Twelve months of supply orders, vendor invoices, or software subscriptions, transcribed into line items, sorted into categories you choose, totaled by category. Almost every small business we look at has a version of the snack line: a category nobody owns and everybody assumes is small.
The reason the audit works is not that AI is clever about money. It is that AI will read hundreds of line items without getting bored, and a busy owner will not. The whole trick is patience you do not have to supply yourself, and it is available this afternoon for the price of an hour. When the pattern turns out to be worth fixing every month instead of once, that is the point where a system worth automating exists, and where a recurring report beats a one-time cleanup.
We started with the household version because we wanted to be honest about the numbers, and it is easier to be honest with your own receipts than with someone else's books. A third of ours was snacks. Your third is something else. You will not know which until you look.
Want this run for your business?
Book a free discovery call. We map where AI fits, show you the numbers, and point you to the right plan. No pressure, no jargon.
Book a Discovery Call →